Amazon.com Pullback Near $250 Puts $244.83 Liquidity in View
Amazon.com pulled back to around $255.38 after failing to hold $270. Nevora80’s chart targets the $244.83 liquidity zone amid 39% AWS growth and a $42.4 billion free-cash-flow decline.
By Amara Osei
3 min read
By Amara Osei
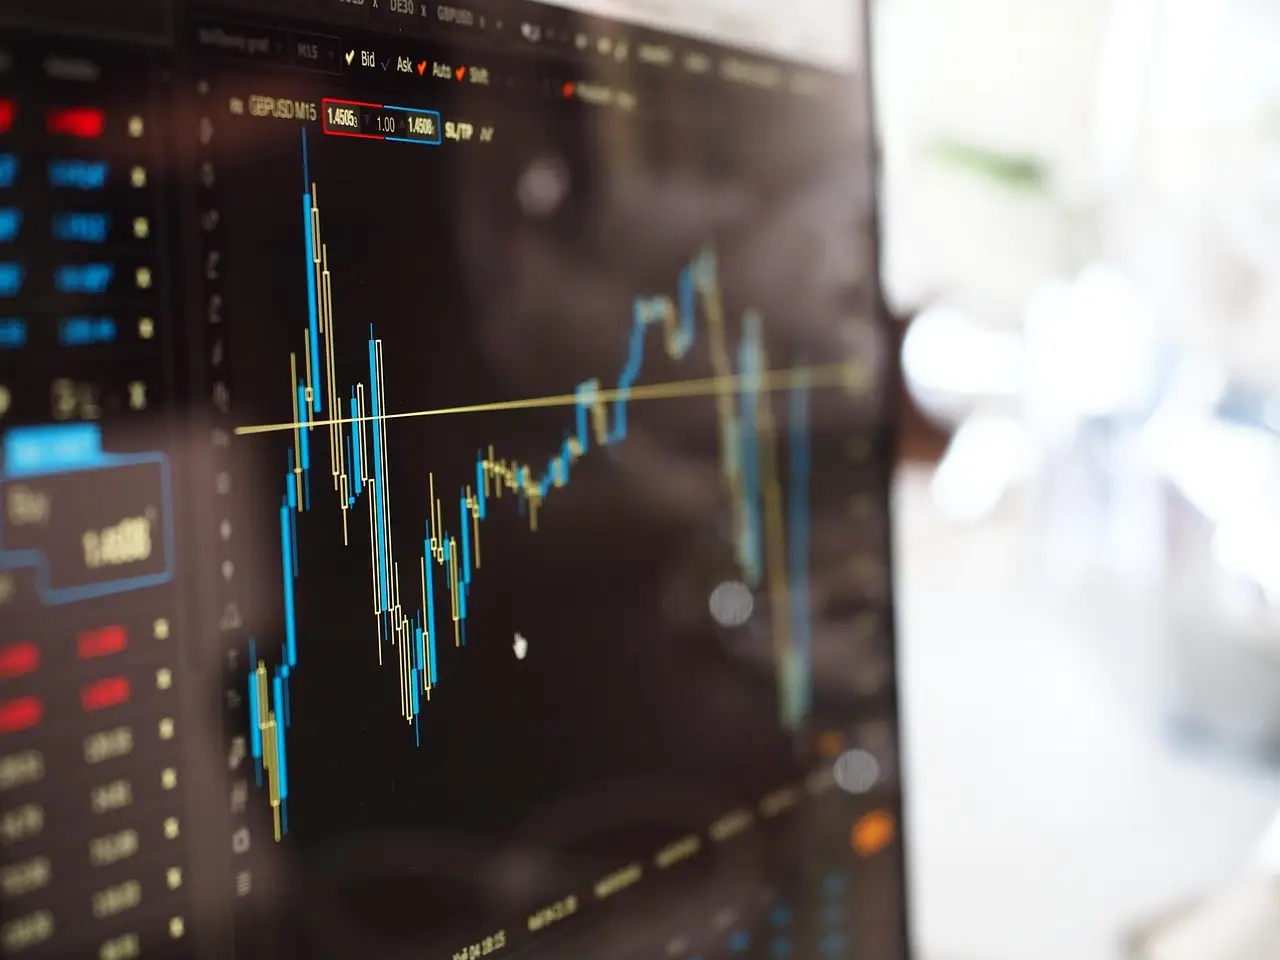
Amazon.com’s price pulled back to around $255.38 after failing to hold above $270, according to Nevora80’s TradingView chart analysis. The 4-hour chart shows renewed weakness, and the author wrote that “sellers appear to be gaining control.”
What does the 4-hour chart show?
Nevora80’s TradingView post tracks Amazon.com, Inc. under the BATS:AMZN symbol and carries the title Is Price Heading Back Toward $245? The author identified the area around $250 as the next level to watch. In Nevora80’s framework, $250 is the immediate reference point, while the $244.83 liquidity zone sits below it.
Nevora80’s downside scenario depends on selling pressure continuing. The $244.83 liquidity zone could then become a target, according to the analysis. The author wants to see how Amazon reacts around $250 before drawing a firmer conclusion from the chart.
In Nevora80’s framework, a recovery above $256.51 would provide the first counter-signal. The author called that move an early sign that buyers were returning, but wants stronger confirmation before changing the view. The chart therefore presents a conditional setup rather than a settled direction at the stated $255.38 price.
How strong are Amazon’s operating results?
Amazon still has a strong AI growth story, according to Nevora80, despite the weakness visible on the 4-hour chart. The author cited Q3 2026 total revenue up 12% year over year at $201.9 billion and AWS revenue up 39% at $46 billion. Those figures support the author’s description of a strong AI growth story.
Operating income also reached $28.1 billion, according to Nevora80’s chart commentary. The analysis pairs that result with the revenue and AWS gains when assessing the strength of Amazon’s AI growth story.
Free cash flow moved in the opposite direction. It was negative by $42.4 billion over the trailing 12 months, according to Nevora80, who attributed the decline largely to increased investment in AI infrastructure. The author said that spending is worth keeping an eye on.
Where does cash flow change the AI case?
Nevora80’s figures set up a tension inside the AI investment case. Revenue reached $201.9 billion and operating income reached $28.1 billion, yet free cash flow was negative by $42.4 billion as infrastructure spending increased.
Read together, Nevora80’s post presents two issues for investors to monitor: the failure to hold above $270 and the $42.4 billion trailing-12-month free-cash-flow deficit. One concern comes from price action; the other comes from the scale of investment in AI infrastructure.
What does Anthropic pricing add?
Anthropic’s IPO adds another layer to the AI market discussion, according to Nevora80. The author said the IPO was priced at $83, while ANT perpetual futures previously traded around $100. Nevora80 called the difference in market pricing worth following as a separate signal within the AI market.
The author has also watched ANT perpetual activity on Bitget. Nevora80 said that narrative should not distract from what AMZN’s chart is showing. The comparison remains contextual; the post returns to Amazon’s $250 level, $256.51 recovery threshold and $244.83 liquidity zone.
Where does this leave Amazon?
Nevora80 remains cautious about the immediate setup. The author wants to see how Amazon responds around $250 and whether liquidity near $244.83 gets tested. A move above $256.51 would be an early sign of returning buyers, but the analysis stops short of treating it as sufficient confirmation.
Nevora80 stated: “For now, my bias is cautious.” The post closes with an NFA disclaimer. Its forward-looking conclusion is conditional: continued selling would put the $244.83 liquidity zone in focus, while a recovery above $256.51 would require stronger confirmation before the author changes the view.
For Amazon, the next price action around $250 carries more weight in this framework than the Anthropic futures narrative. The source does not present a confirmed break below $250 or a completed recovery above $256.51. It leaves investors with two defined thresholds and a cautious bias while they wait for confirmation.
Source: tradingview.com
More from Amara Osei
Show full bio
Senior reporter covering companies, deals and strategy in entrepreneurship, startups and venture funding at Business Bearings.
2,503 articles