That 25-Point Overnight Jump on Your Futures Chart May Be Fiction
A 25-point gap on a continuous futures chart can equal $1,250 per ES contract — without the index moving. Plus500 explains rollover mechanics and chart choice.
By Nathan Brooks
4 min read
What's News
- A rollover from ES at 6,000 to 6,025 creates a 25-point chart gap worth $1,250 per contract at $50 per point.
- Platforms use fixed-date, volume-based or exchange-calendar rollover rules, so gaps can appear on different days across platforms.
- Back-adjusted charts shift historical prices by the rollover spread, producing smooth series that may not reflect traded prices.
- Plus500 recommends individual contract charts for execution and stops, continuous charts for long-term context.
- Plus500US Financial Services LLC is a CFTC-registered FCM and NFA member (ID 0001398).
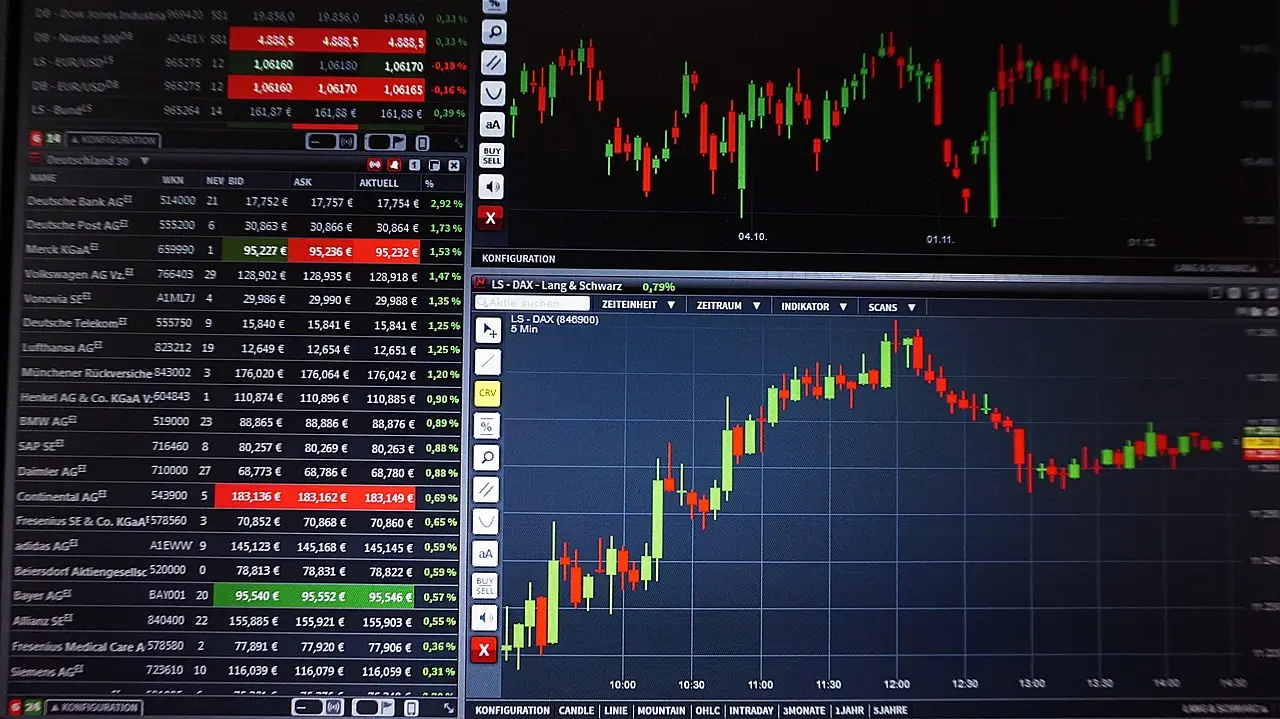
A 25-point jump on a continuous E-mini S&P 500 futures chart can represent $1,250 per contract — and the underlying index may not have moved at all. Plus500's trading team laid out this week why futures charts develop sudden gaps, and why traders who mistake them for real market moves risk wrecking their technical analysis, stop levels and backtesting results.
The mechanics are simple. Each futures contract has an expiration date. As expiry approaches, traders roll positions into a later-dated contract to keep their exposure. A continuous chart stitches those contracts together so you don't have to switch charts manually — but the two contracts may trade at different prices.
Plus500's illustrative example: December E-mini S&P 500 (ES) futures trading at 6,000 while March ES futures trade at 6,025 around the rollover. When the continuous chart switches contracts, it shows a 25-point jump the index never made. At $50 per point for ES, that's $1,250 per contract of pure data artifact.
Why do different platforms show gaps on different days?
Charting platforms don't share a single rollover date. The switching depends on each platform's rules. The three common approaches:
- Fixed-date rollover — the chart switches on a preset date or a set number of days before expiration.
- Volume-based rollover — the chart switches when volume migrates to the later contract.
- Exchange-calendar rollover — the chart follows a date or rule tied to the exchange's contract calendar.
Different methods produce different switching dates. Two platforms can show a gap on different days for the same instrument. If you're comparing charts or reviewing a historical trade, Plus500 advises checking which contract was active and how the chart handles rollovers.
What is a back-adjusted chart?
Some platforms use back-adjustment to smooth the seams. When the chart rolls to a new contract, historical prices are shifted by the difference between the old and new contracts around the rollover. The result is a cleaner long-term series.
The trade-off: adjusted historical prices aren't necessarily prices at which the market actually traded. That matters when you're analyzing exact price levels, historical entries, stop-losses or strategy performance. An unadjusted continuous chart preserves original contract prices but shows rollover gaps. Which one serves you better depends on what you're analyzing.
Which chart should you use?
Plus500's guidance splits cleanly by task. Use individual contract charts for:
- Planning entries and exits
- Placing stop-losses and profit targets
- Reviewing actual fills
- Analyzing precise price levels
- Checking price action around expiration
Use continuous charts for:
- Studying longer-term trends
- Reviewing historical market structure
- Comparing price behavior across periods
- Analyzing broader patterns without manual switching
The short version: individual contracts for execution-level analysis, continuous charts for market context.
Six rollover mistakes that cost money
- Missing the expiration deadline. Holding an expiring contract too long can expose you to settlement, physical delivery or broker-imposed liquidation.
- Rolling into an illiquid contract. Later-dated contracts can carry wider spreads and thinner depth. Compare liquidity before switching.
- Mistaking a chart gap for a market move. Check individual contract prices before reacting to a jump on a continuous chart.
- Ignoring the full cost. Commissions are only part of it — bid-ask spreads, slippage and the price difference between contracts all affect roll economics.
- Forgetting working orders. Stops and profit targets are tied to a specific contract. They may need to be canceled and re-entered.
- Overlooking margin. Open the new position before closing the old one and you may temporarily need margin for both.
Plus500 also publishes a before-and-after checklist: confirm the contract month and last trading day, check First Notice Day for physically delivered contracts, verify broker deadlines, compare volume, open interest, spreads and depth across both contracts, and confirm sufficient margin. After rolling, verify the old position is fully closed, confirm the new contract, size and direction, re-enter working orders and check fills against your plan.
The practical takeaway for traders: before treating any gap as a breakout, check which contract you're viewing and whether the chart uses back-adjusted prices. For precise entries, exits and stops, use the actual contract you're trading — not the continuous series.
Trading in futures and options carries substantial risk of loss and is not suitable for every investor, per Plus500's disclaimer. Futures trading is available through Plus500US Financial Services LLC, a Futures Commission Merchant registered with the CFTC and a member of the National Futures Association (NFA ID 0001398).
Source: tradingview.com
More from Nathan Brooks
Show full bio
News editor covering regulation, policy and their impact on entrepreneurship, startups and venture funding at Business Bearings.
2,030 articles