Wider Stop, Smaller Position: The Math Every Trader Skips
A $50 risk budget yields 200 shares at a $0.25 stop and 20 at $2.50. The hi2morrow team's TradingView piece shows why stop distance, not habit, should set position size.
By Grace Kim
3 min read
What's News
- With a $50 risk budget, a $0.25 stop allows 200 shares while a $2.50 stop allows 20.
- At a 40% win rate, a 10-loss streak appears in about 9 of 10 runs of 1,000 trades.
- At 0.5% risk per trade, 20 straight losses cost about 10%; at 2%, roughly a third.
- A $0.25 stop filling at $0.60 after an overnight gap produces a 2.4R loss.
A stop placed $2.50 away should carry one-tenth the position of a stop placed $0.25 away — and a single $50 risk budget proves it. That is the core of a new educational piece from the hi2morrow team published on TradingView, built around a chart of the Invesco QQQ Trust Series I (BATS: QQQ). The authors frame it plainly: position size follows from where the stop sits, because the stop marks the point where the idea is wrong and the size decides what being wrong costs.
How does the sizing formula work?
The method starts with one number: the amount a trader accepts to lose on a single trade, which the authors call 1R. Shares equal 1R divided by the distance to the stop.
With 1R set at $50, the arithmetic runs like this:
- Stop $0.25 away: 200 shares
- Stop $1.00 away: 50 shares
- Stop $2.50 away: 20 shares
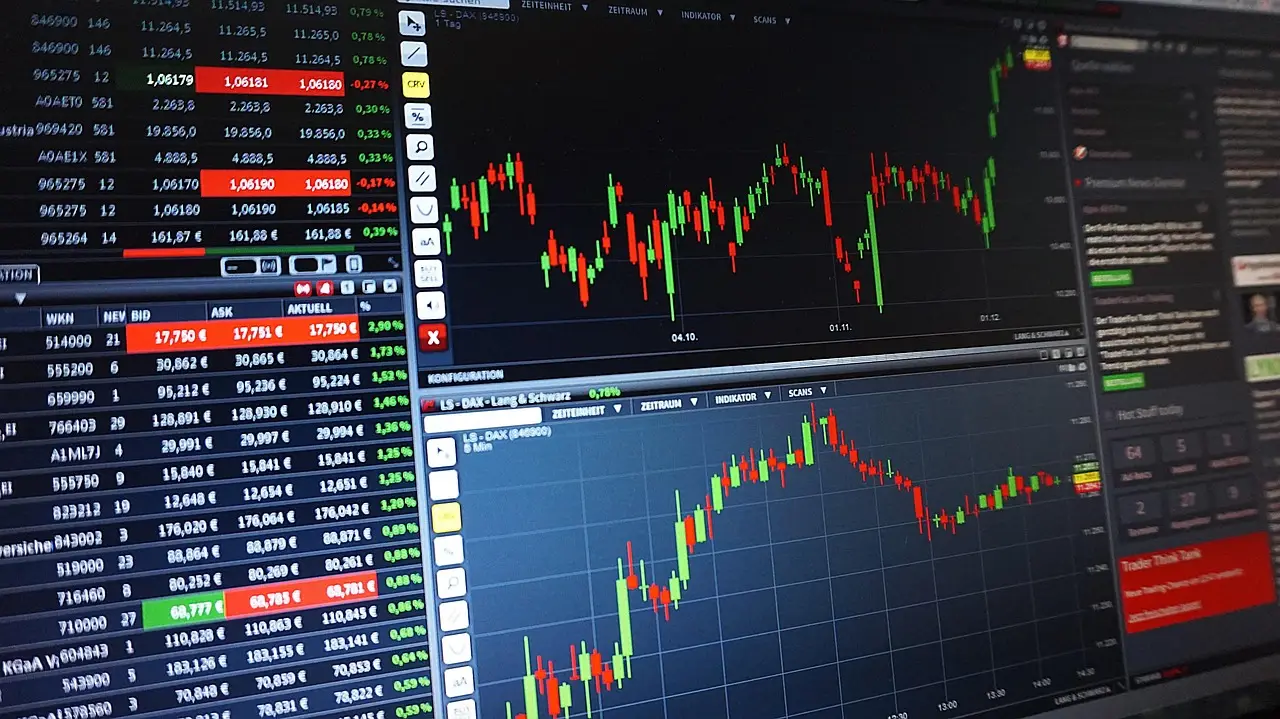
Three very different positions, the same loss if the stop is hit. The authors stress that the chart image repeating this arithmetic is an illustration, not a trade idea.
Why keep the per-trade risk small?
The hi2morrow team grounds the case for a small 1R in streak statistics. At a 40% win rate, a streak of 10 losses appears in about 9 of 10 runs of 1,000 trades. A streak of 20 losses shows up in roughly 1 of 70 such runs.
The damage those streaks do depends directly on the risk per trade:
- At 0.5% of the account per trade, 20 consecutive losses cost about 10%.
- At 2% per trade, the same streak costs roughly a third of the account.
Same losing run, three times the drawdown. That gap is the entire argument for capping 1R low.
Where does the method break down?
The authors list four specific failure modes. Each one, they argue, breaks the link between the chart and the position.
- The same share count every time. A $0.25 stop and a $2.50 stop then carry tenfold different risk.
- The same dollar amount every time. The positions look equal and the risk is not, because the stops are not.
- Moving the stop after entry to keep a size that already feels right. The stop comes from the chart and the size follows from it, not the other way around.
- Treating 1R as a fixed loss. Stocks gap. A $0.25 stop that fills at $0.60 after an overnight gap is a 2.4R loss, so the gap risk of holding overnight belongs in the plan before entry.
The gap example is the sharpest number in the piece: a stop designed to cost one unit of risk instead delivers 2.4 units, purely because the market opened beyond it. Planning for that scenario, the authors imply, is what separates a risk budget from a wish.
The piece closes with a sign-off from the hi2morrow team and a standard disclaimer: educational content only, not investment advice. Still, the practical takeaway is hard to miss — traders who size positions by habit rather than by stop distance are running risk that swings tenfold from trade to trade, and the fix costs nothing but a division.
Source: tradingview.com
More from Grace Kim
Show full bio
Market editor covering people, launches and day-to-day practice in entrepreneurship, startups and venture funding at Business Bearings.
1,986 articles