QQQ Falls 1.2% to 679.89 as 696.13 Moving Average Caps Rally
QQQ closed at 679.89, down 1.2%, with the 21 MA at 696.13 acting as the lid. Analyst watches 671.68 and the 647.05 floor as chatter hits 3.13x normal.
By Grace Kim
3 min read
What's News
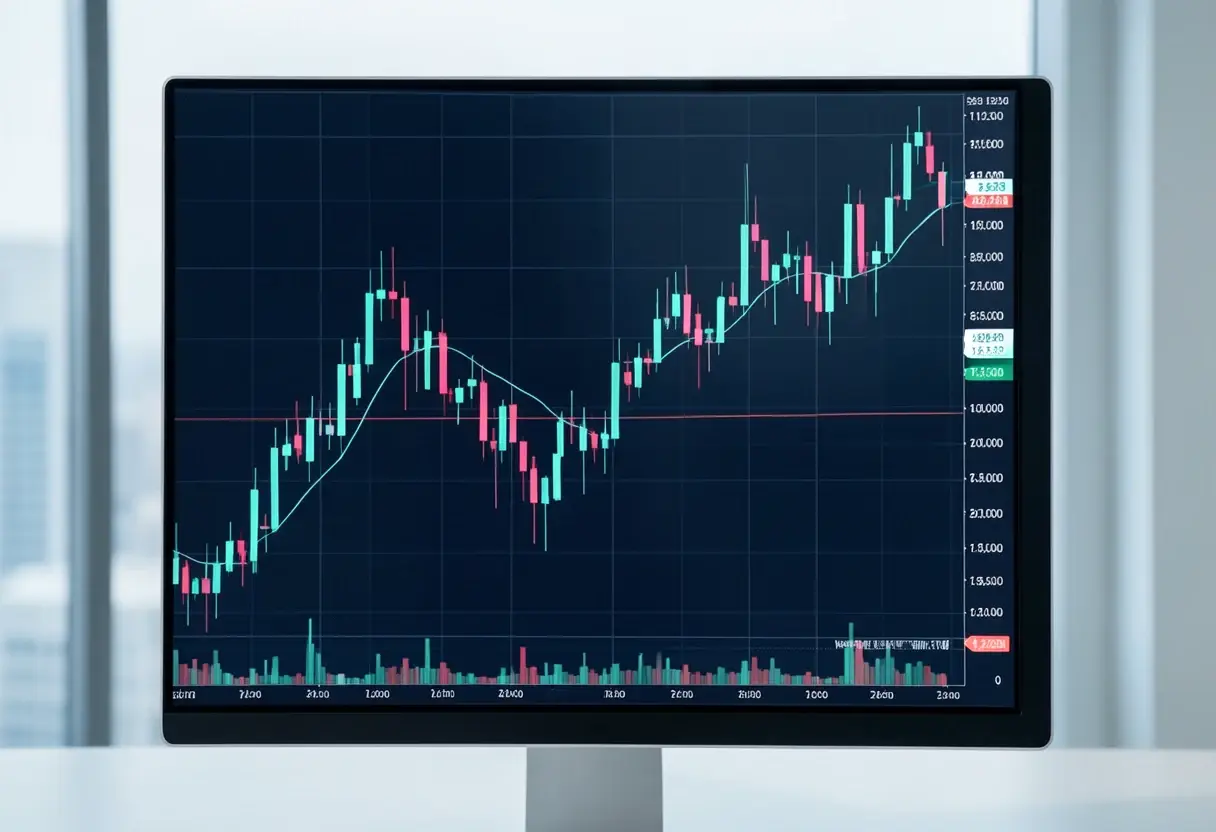
- QQQ closed Friday at 679.89, down 1.2%, its second straight down close after 688.17.
- Price sits 2.33% below the 21 MA (696.13) and 5.29% below the 50 MA (717.87); both slope down.
- The 60-day low is 647.05 (5 Nov); the 60-day high is 762.86 (6 Oct).
- Nasdaq-related posting on X is running at 3.13x normal volume, per Forexupgo.
- Key levels: 696.13 resistance, 671.68 Friday low, 647.05 60-day floor.
By Grace Kim
The Invesco QQQ Trust Series I (BATS: QQQ) closed Friday at 679.89, down 1.2% on the day and marking its second consecutive down close after finishing at 688.17 the session before. That's the hardest number on the tape right now, and the chatter around it is loud: posting volume about the Nasdaq on X has hit 3.13 times normal levels, according to chart analysis published by TradingView analyst Forexupgo.
The numbers tell a story of a fund stuck in a pullback. Over five sessions, QQQ is still up 3.63%. Stretch the window to 20 sessions and it's down 4.21%. The 60-day low sits at 647.05, printed on 5 November. The 60-day high is 762.86, set on 6 October. All prices here are QQQ ETF levels, not Nasdaq index points.
Why does the 696.13 level matter?
Price closed 2.33% below the 21-day moving average, which sits at 696.13. It's also 5.29% below the 50-day moving average at 717.87. Both averages are sloping down — and the last five closes have all printed below the 50 MA.
The 15-day trading box runs from a floor of 647.05 to a ceiling of 726.14. Price currently sits in the lower half of that range. Takeaway: the trend structure is bearish on every timeframe the analysis covers.
What levels is the market watching?
Forexupgo laid out three prices that frame the next move:
- 696.13 (21 MA): the first lid. A daily close back above it would be the first change in structure.
- 671.68: Friday's low. A close under it puts the 647.05 floor back in play.
- 647.05: the 60-day low. Losing it opens a new leg lower; holding it keeps the box intact.
The framing is simple. Reclaim the 21-day moving average, or lose Friday's low first. Whichever breaks first sets the direction.
What about the calendar?
There are no scheduled economic releases on the analyst's calendar. That leaves the tape itself as the signal. Forexupgo's warning is worth quoting directly: "A move with 3.13x normal chatter can reverse quickly, so I wait for closes, not headlines."
That discipline matters here. Elevated social-media volume around the Nasdaq — 3.13x the norm — cuts both ways. It can mark capitulation at a low, or it can fuel a quick reversal when positioning is crowded. The analyst's response is to discount intraday noise entirely and act only on daily closes.
What's the so-what?
The setup compresses into one line: QQQ is trapped between a falling 21 MA at 696.13 overhead and the 60-day floor at 647.05 below, with Friday's low of 671.68 as the first tripwire. Hold 647.05 and the 15-day box survives; lose it, and the path opens to a fresh leg lower. The analysis is explicitly marked as not financial advice, but the level map is the tradeable part.
The next daily close above 696.13 or below 671.68 is the signal to watch — not the volume of Nasdaq posts on X.
Source: tradingview.com
More from Grace Kim
Show full bio
Market editor covering people, launches and day-to-day practice in entrepreneurship, startups and venture funding at Business Bearings.
2,178 articles